
Berkshire’s BRITS System
A B2B CRM product making insurance claims easier to track

Problem Overview
Berkshire Risk Services acts as a broker between financial institution clients (Creditors) that loan vehicles and insurance companies that offer Collateral Protection Insurance (CPI Carriers). With many moving parts and changing client accounts, Berkshire’s main products offered to clients are providing CPI insurance policies, customer support, and data management/tracking. To do these tasks, Berkshire is building their own in-house cloud-based software called BRITS to streamline internal task flows, automate data tracking, and provide clients the ability to file claims and view their clients’ (Borrowers’) data.
While the Development Team at Berkshire has already built core functionality to many task flows, there is an opportunity within the application to provide meaningful data visualization and task flow designs for each primary user. The flow in most need was building out how to file a claim.
Solution & Deliverables
A simplified user flow for internal employees to file a claim
UX/UI recommendations other aspects of BRITS:
Role & Timeframe
Sole UX/UI Designer & Researcher.
This engagement was four weeks long. I spent a week and a half interviewing internal employees, and the remaining two and a half weeks designing and testing solutions with stakeholders and the dev team.
Research
Before diving into any designing, I needed a thorough understanding of Berkshire’s business model. I’ve heard of CPI before but I’ve never fully understood how it works. I interviewed the CEO and almost every department head of the company (Call Center, Data Entry, Claims, Data Control, Reports, and the Mail Room). I took detailed notes and highlighted the needs/requirements of each department.
Overall, I conducted 28 internal stakeholder/employee interviews to help drive design decisions.
Here is a rough flow diagram I created to help me keep track of how Berkshire’s business operates:
This diagram proved helpful not only to me, but to the entire team at Berkshire. No one at the company ever attempted to diagram these relationships. Delivering this asset to the team within my first week proved beneficial—it provided clarity to the development team who needs what information.
Filing a Claim
With the limited time constraint, I rapidly sketched ideas and tested them with the head of the Claims department. He and I went through four rounds of testing, interviewing, and design adjustments before he felt like the design met their needs as a department.
Some guiding UX design principles I leaned on:
Progressive Disclosure
Visual hierarchy
Consistency
Error prevention & recovery
Signal to Noise ratio
Wayfinding
Below is a sample wireframe of step 1 of my design recommendation. View the entire design recommendation deck here.
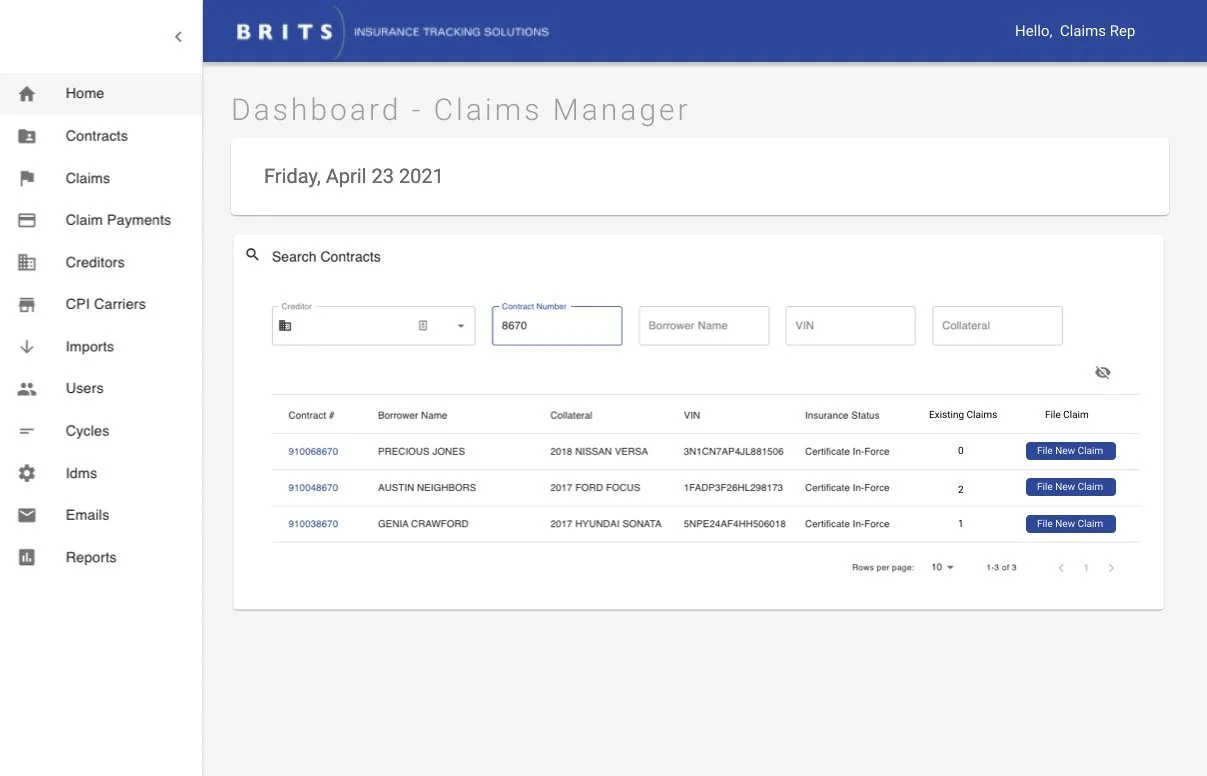
Tracking Statuses
One example of the many design recommendations I offered the team was a redesign of what they call the “Rainbow screen”. This was a running list of creditors and claims with information on their service statuses. Using data visualization principles, I ensured to incorporate the existing color system while making this list much easier to scan and understand.
The “Old” version of the rainbow screen
The “New” redesign of the rainbow screen.
When testing the new design with the Call Center employees, this new version received an overwhelming amount of praise. The Call Center manager felt that this new version would be much easier to work with and onboard her employees with, saving countless hours of her time. This manager spends an entire week with each new employee going through a 20-page document that teaches them how to use the old system.
Conclusion
By the end of my month-long contract, I delivered a folder of my research and recommendations to the Berkshire Risk Services team. I wasn’t afraid to get scrappy. Below are a few other assets that I included in my folder, all of which served to help the development team understand how to build the BRITS system in a way that would be most beneficial to Berkshire’s employees.
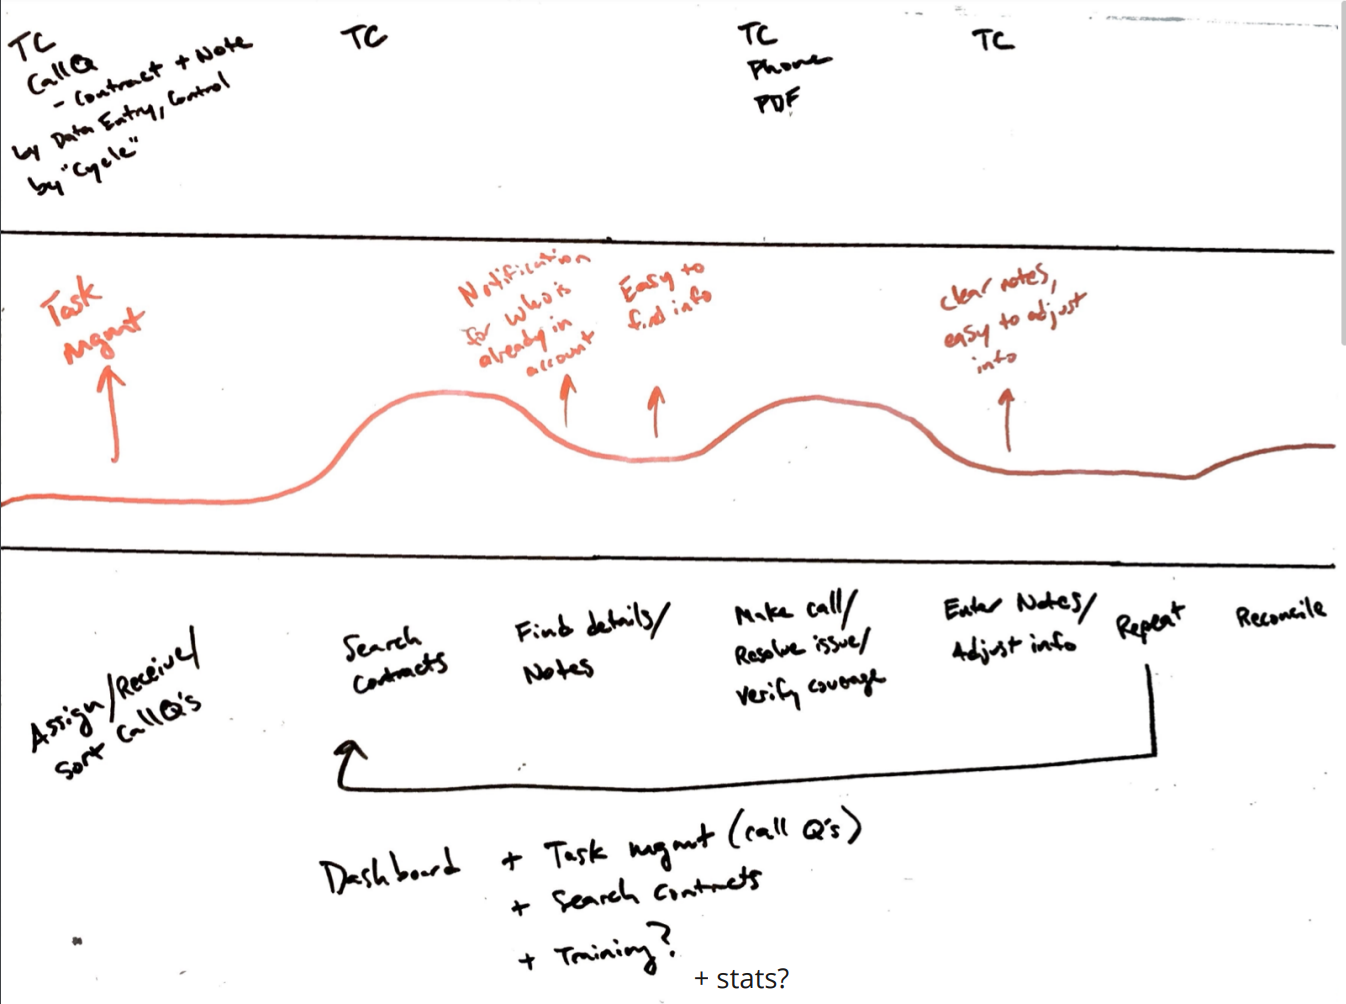
Scrappy whiteboarded Journey Map to help identify opportunities to improve the Call Center’s workflow.
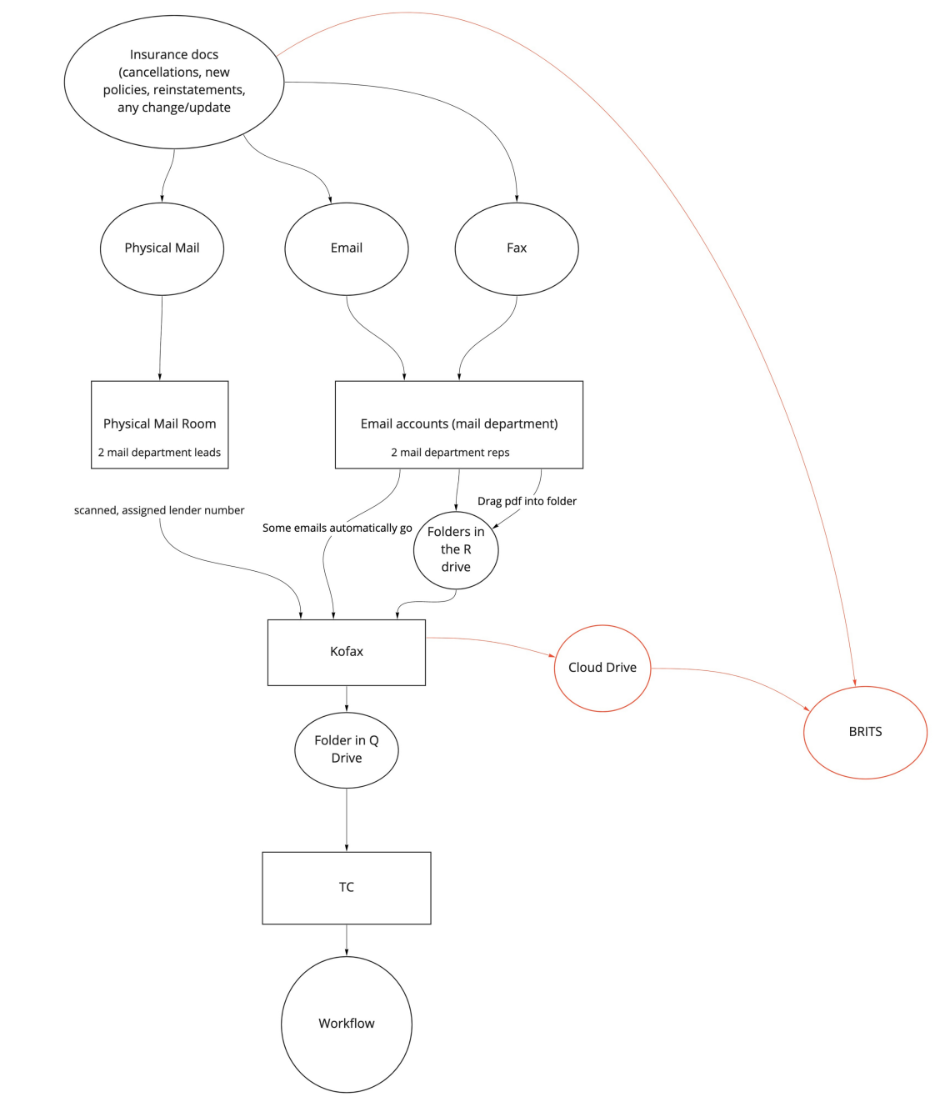
Flow Diagram of the Mail Room, with red indicating on opportunity to simplify workflow with BRITS
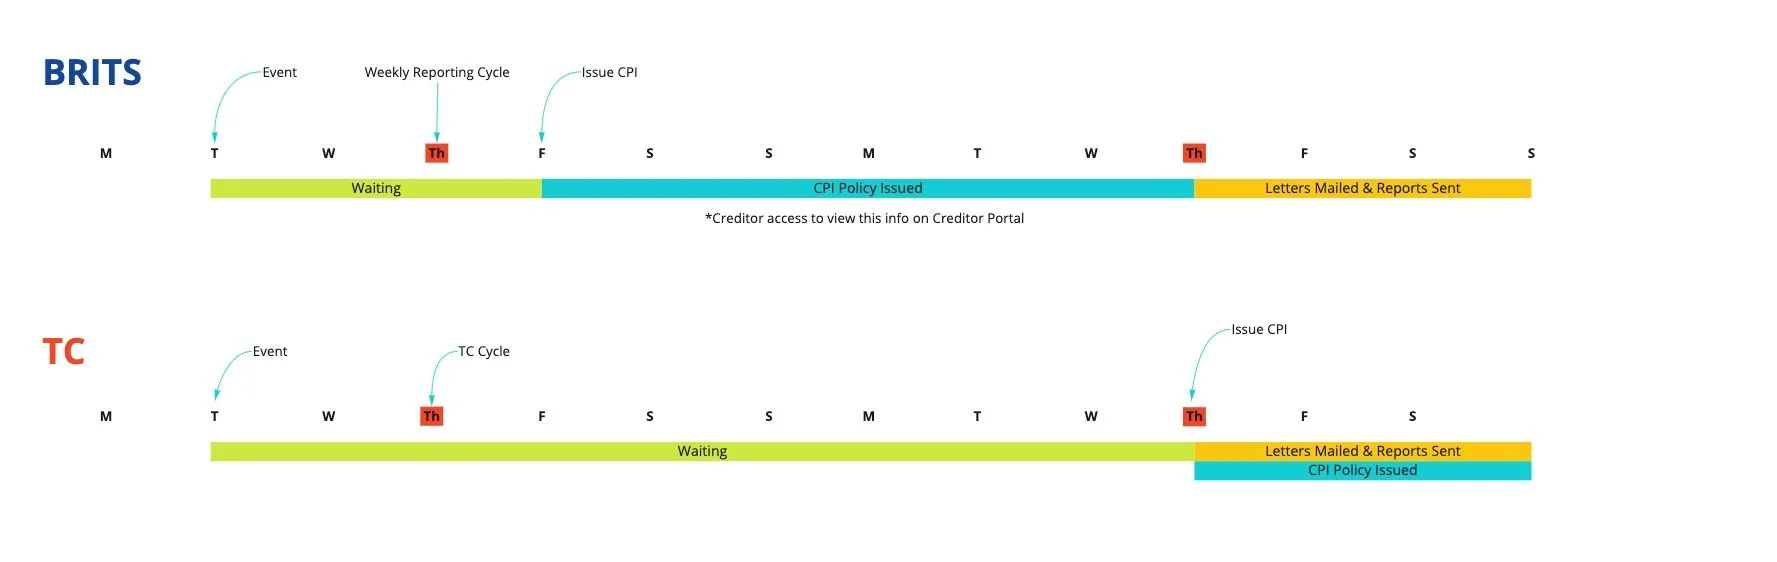
A chart showing the preferred Reporting Cycle in BRITS (above) as opposed to the existing system, TC.